v1.3.0 Graph Browser
The 1.3.0 release focuses on improving the interactivity of graph visualization.
Improved Interactivity for Graph Visualization Nodes
- Support disabling automatic layout
- Nodes that you have dragged and dropped are pinned and will no longer move, even if the layout algorithm changes
After dragging, you can see the blue-circled node seems to be pinned in place, no longer influenced by other nodes, resulting in a more tension-filled layout.
Using Node Attributes as Node Images
When a node’s attribute value is an image URL, you can display that image directly on the node, as shown:

WARNING
Note that there is a known bug in the config, where the descriptions for [Node Name] and [Node Image] are reversed. This was fixed in version 2.0.0.
Paginated Neighbor Nodes
After you click on a node, a table of neighbor nodes appears, with an option to load those neighbors into the graph in pages, as shown below:

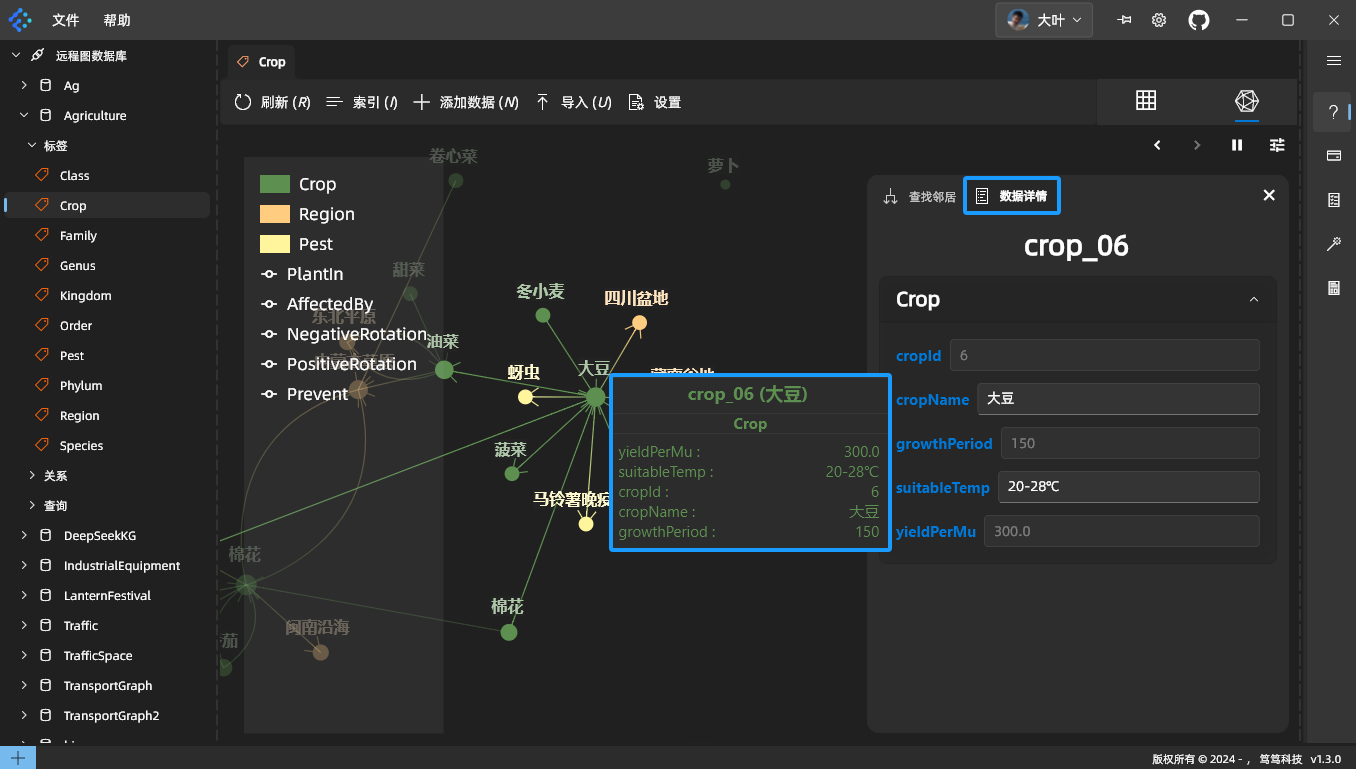
View the Node Data Panel
Two ways to view the data panel for a node:
- Hover your mouse cursor over the node to see its field values. These disappear once the mouse moves away.
- Click the node, and in the panel on the right, switch to the [Data Details] tab to see detailed information for the node.
As shown here:
Neighbor Node Routing
Adjusting Layout Algorithm Parameters

Category-Based Control of Graph Data
New Quick-Add Entry in the Main Interface
When a graph space is selected, click the [Quick Start] button in the lower-left corner to quickly create tags, edges, queries, and more. Illustrated below: